
Lab Group: Steffen Seamon, Simon Cohen
Date of Inquiry: 9-20-18
Land Use/Cover Change Lab Week 4
Background
Over the last month, we have been observing 12 distinct sites across the Collins View neighborhood, River View Natural Area (RVNA), and the Lewis and Clark campus to observe changes due to land use. In the first week, we established our site in Collins View and made preliminary observations on how the development of a suburban neighborhood affects a previously forested area. We went back to our site and collected quantitative data on the land cover of our site in the second week. Last week we found ways to express our data graphically so that we could draw comparisons between all the sites and general locations. We found some patterns regarding temperature and humidity and the ground and canopy coverage across the sites. Temperature and humidity not vary greatly between the general locations on the day that we observed. As would be expected, RVNA was the most forested. This week, we took our data and input it into GIS. We did this to create spatial analysis of the quantitative observations we gathered over the last month. Understanding our data spatially will improve our understanding on how land use has been affected by cover change in the specific area that these labs have been focused on.
Procedure
This week we plotted our data on a map of the area we are studying. To do this, we used arcgis.com. Arcgis.com is a platform that allows users to use the geographic information systems to create maps to express a variety of purposes. To display our data, first we had to import region markers of the three general locations we studied. Then we imported all of our quantitative data gathered in the first two weeks of the lab. This allowed us to plot any of these quantitative data spatially over the 12 sites. Then we took three aerial images of the area and individually superimposed them over our map in arcgis.
Results
 Average temperature (ºC) of the 12 sites (data is skewed due to entry error of site on LC campus)
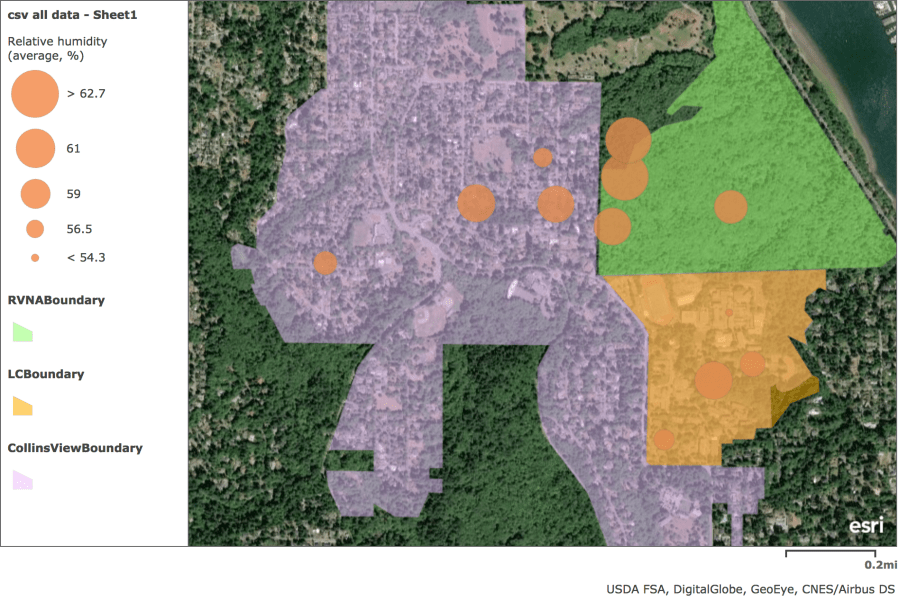 Average humidity (%) of the 12 sites, RVNA had the overall highest
 Percent canopy cover of the 12 sites, RVNA had the highest because it is forested
 Percent ground cover of 12 sites, RVNA had the highest
 Percent green (covered by living plants) ground cover of the 12 sites, Collins View is quite low
Percent brown (dead plant material) ground cover of the 12 sites
Slides of area observed in 1939, 1961, 1982, and 2018
Discussion
The data that we expressed spatially is the same data that we presented in the lab from last week. Using maps we are able to see where our data is situated rather than just associating it with one of three general locations. It allows to see the data grouped which can make it easier to see trends between the sites in the three general locations. From these maps, we can tell that RVNA has by far the most canopy and ground cover. RVNA is the only undeveloped location of the three that we studied. From this, we can say that development in both Collins View and on the Lewis and Clark campus has removed vegetation and impeded the growth of new plant life. This becomes even more apparent when comparing current satellite images to aerial pictures of this area from the past.
In the slides presented in the result section are four aerial photographs presenting the are studied in 1939, 1962, 1982, and 2018. The three general locations and 12 sites are also marked on each map. RVNA’s land cover has remained constant over the last 49 years. The Lewis and Clark campus has grown, but also retained and regrew some of the forest. Collins view has progressively become developed. In 1939 in Collins View, lots of the forest had been removed large plots were already established. Over the course of 49 years, the neighborhood has become less forested and those plots have become mostly split into single house properties. The usage of land in Collins View has intensified. There are presumably more people (since there are more dwellings) in the same space than there were in 1939. The population has most likely become more dense which has led to greater transformation of the land for human use. It is evident that if RVNA were not protected, the same would probably happen to that location as well. Growing populations desire more to live even if that means removing the natural environment and deforesting the area.
